Introducing our new climate risk visualization tool 🌍
At Data4Risk, we are pleased to announce the launch of our new feature: Climate Risk Visualization Tool. This tool is designed to provide companies and institutions with real-time insights into environmental threats. It helps them effectively understand and manage climate-related risks, enabling more informed decision-making.
What is the climate risk visualization tool?
This new feature allows users to visualize their exposure to various climate phenomena such as droughts, wildfires, heavy rainfall, and flooding.
By leveraging cutting-edge technology and data analytics, this tool provides a comprehensive view of potential climate-related risks that could impact operations, supply chains, and overall business sustainability.

Key features
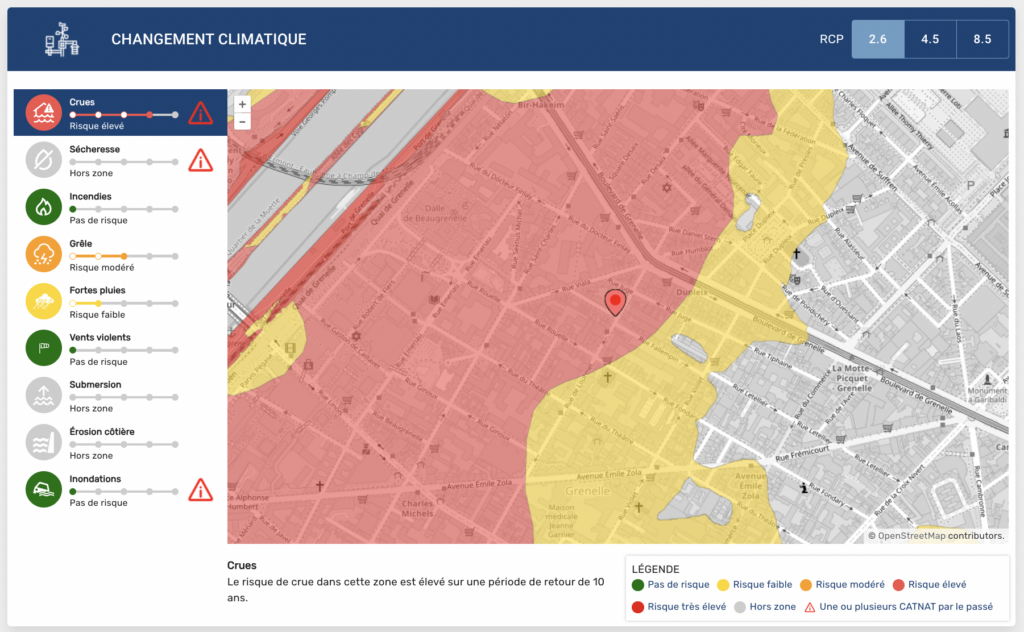
- Interactive map interface: The tool features a user-friendly map interface that highlights different climate risk levels across various regions. Users can easily zoom in on specific areas to assess their risk exposure, which is color-coded for clarity (e.g., red for high risk, yellow for moderate risk).
- Detailed risk indicators: Users can view specific risks such as floods, droughts, and heavy rainfall with detailed descriptions, helping them understand the potential impacts of these phenomena on their operations.
- Historical data and projections: The tool provides insights based on historical data and future projections, enabling organizations to prepare for possible climate scenarios.
How to use it?
Using the tool is straightforward and intuitive:
- Log In: Access the tool through your Data4Risk account.
- Enter an address: Choose the geographic area you want to assess. The tool provides coverage for various regions, allowing for localized risk assessment.
- Visualize risks: Explore the interactive map to see climate risk levels in your selected area. Adjust the parameters to focus on specific risks relevant to your organization.
- Analyze results: Review the visualizations and reports generated by the tool to understand your exposure to different climate threats.
Benefits
- Informed decision-making: With accurate and real-time data at your fingertips, you can make strategic decisions that align with your organization’s risk management and sustainability goals.
- Proactive risk management: Identify and understand potential climate risks before they become significant issues, allowing you to implement preventative measures and minimize impact.
- Enhanced communication: Easily share visualizations and reports with stakeholders, fostering collaboration and transparency in climate risk management.
- Tailored insights: The tool provides customizable reports that can be adapted to your organization’s unique needs, helping you prioritize actions based on specific vulnerabilities.
- Regulatory compliance: Stay ahead of regulatory requirements by demonstrating proactive measures to assess and manage climate risks.
Conclusion
The Climate Risk Mapping Tool represents a significant advancement in our commitment to providing actionable insights for climate risk management.
By equipping organizations with the tools to visualize and understand their environmental threats, Data4Risk aims to foster a more resilient and sustainable future.
For more information or assistance, please contact our support team. We’re here to help you navigate the challenges of climate change effectively.
